
CFO-Level Clarity,
Without the CFO Overhead
WinCFO turns your financials into the same model a CFO would build — labor efficiency, targets, forecasts, and valuation — so you can decide faster without hiring one.
See your own numbers in a live, hands-on walkthrough.
How It Works
Bring Your Numbers
Import a P&L and Balance Sheet from any accounting system — or connect QuickBooks Online directly
AI Classification
AI classifies every line item into a CFO-ready model in minutes
Instant Dashboard
Get a live dashboard, targets, forecasts, and a valuation view — instantly
Key Metrics at a Glance
The numbers that tell you whether your business is actually working — and why each one matters.
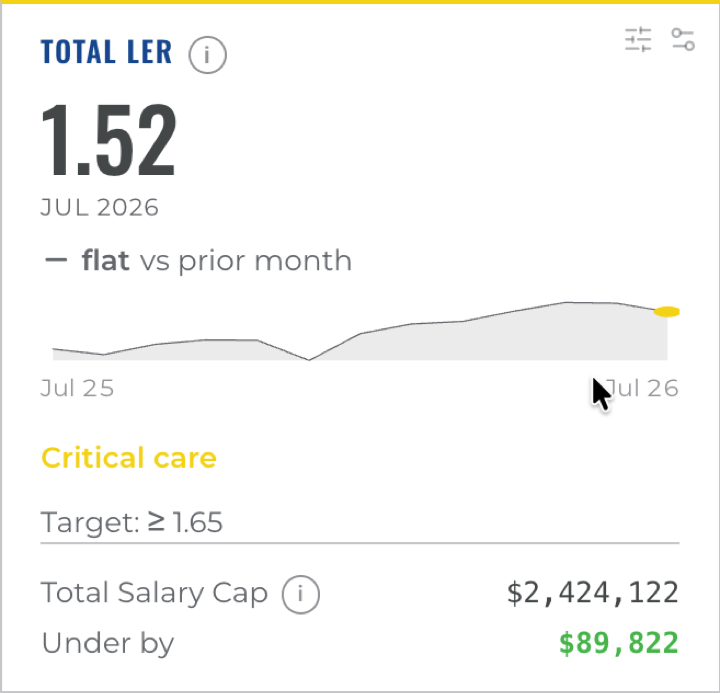
Labor is the biggest lever in most businesses. Total LER weighs every labor dollar against the gross margin it produces — the fastest read on whether your team is truly affordable.
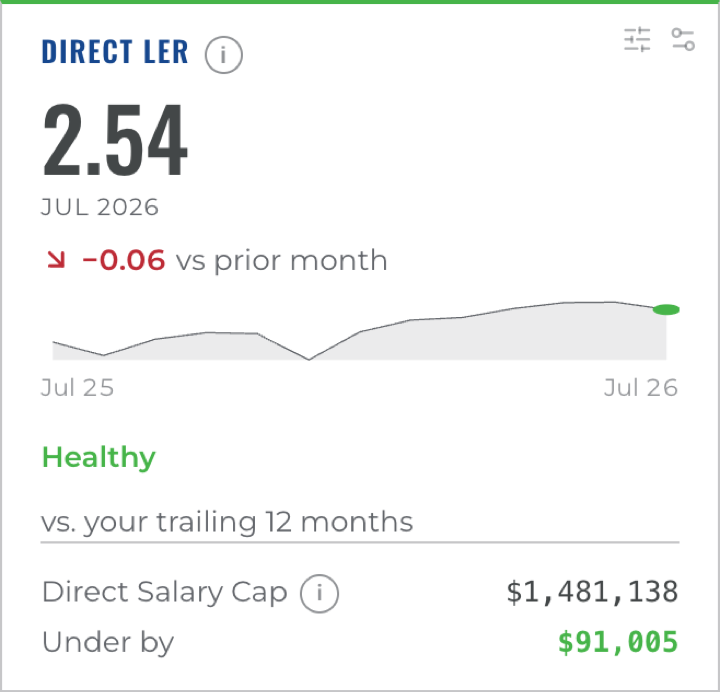
Isolates the people who deliver the work. It tells you whether your production team is generating enough margin to justify what it costs.
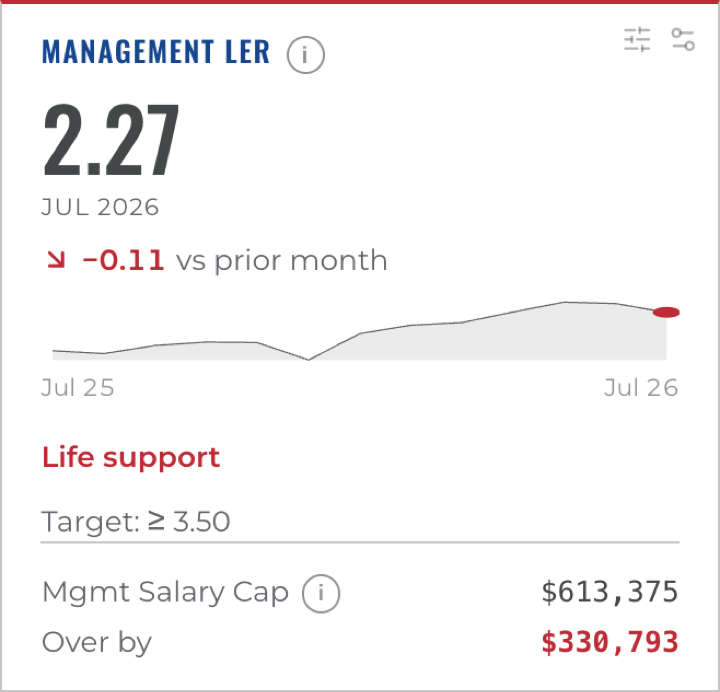
Overhead labor is where profit quietly leaks. This shows whether your management layer is sized to what the business can actually carry.
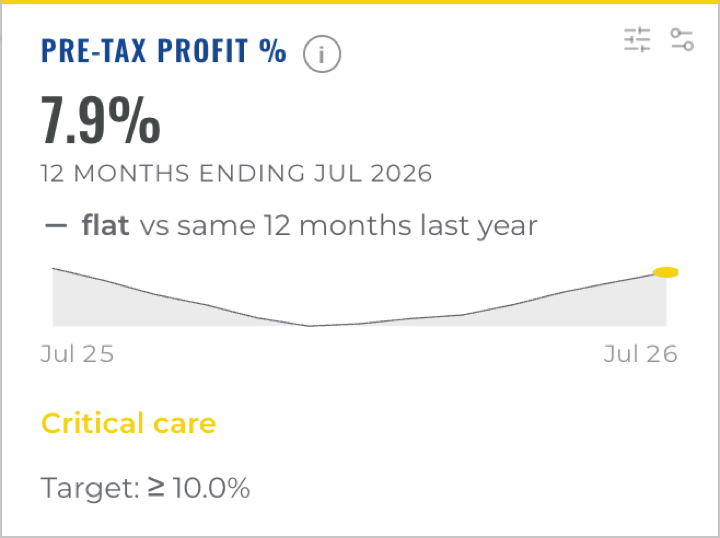
The bottom line as a share of revenue — the health line. Below it, the business is running on fumes no matter how busy it feels.
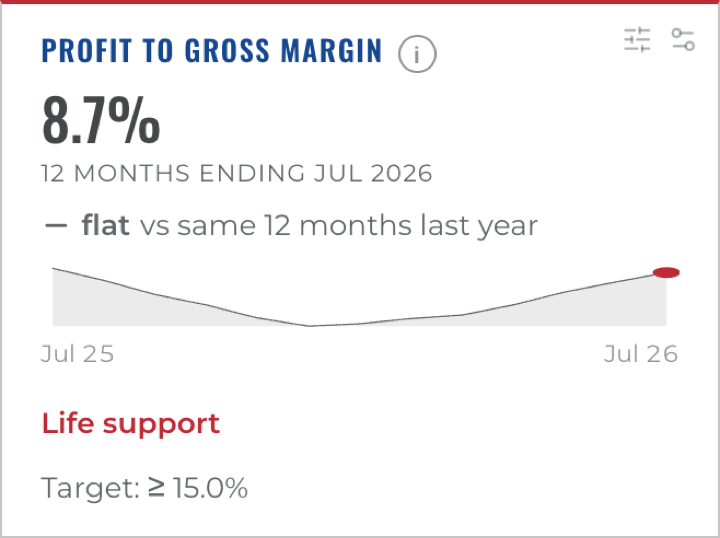
Profit measured against the margin you actually control. A truer efficiency read than profit-to-revenue, because it strips out pass-through costs.
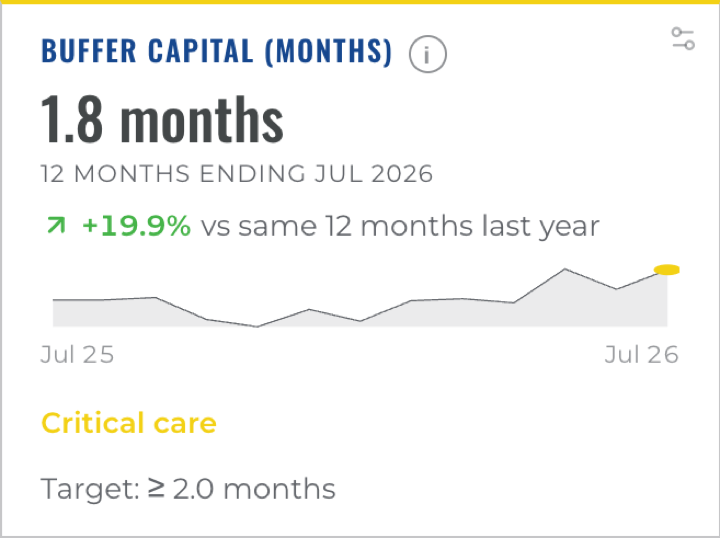
Cash is survival. This tells you whether you hold enough of a buffer to weather a bad quarter without reaching for a line of credit.
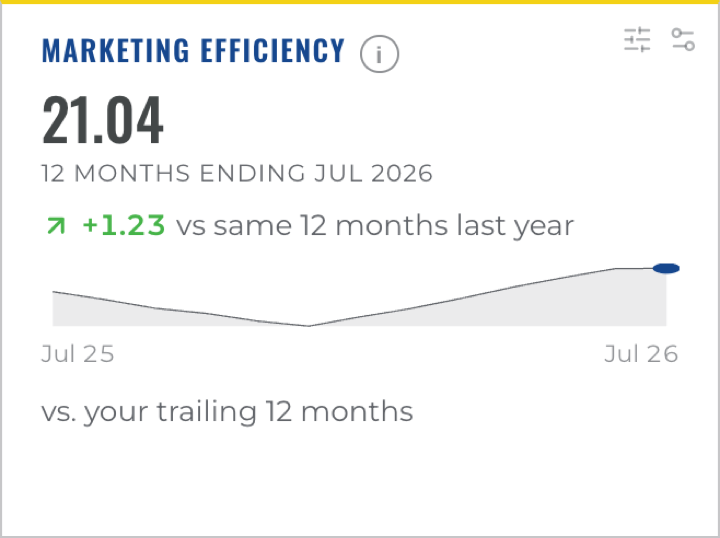
Every marketing dollar should return margin, not just revenue. This shows whether your spend is buying real growth or just noise.
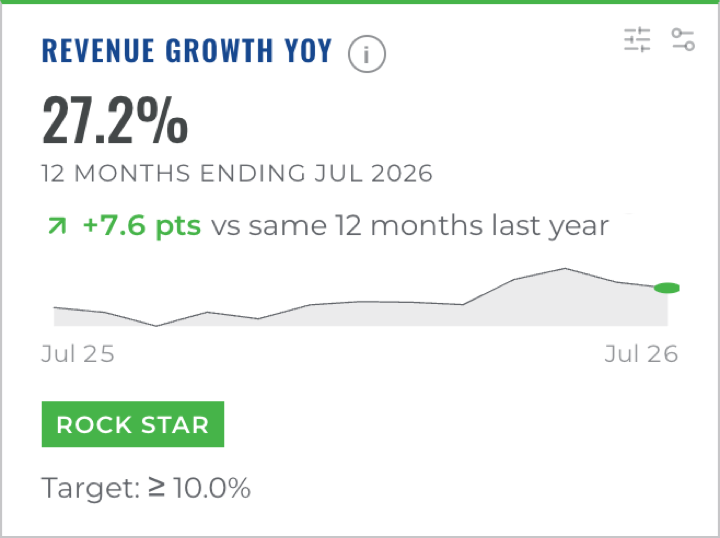
Growth only counts when margin and capital keep pace. This tracks the top line in context, so you don’t celebrate revenue that costs you money.
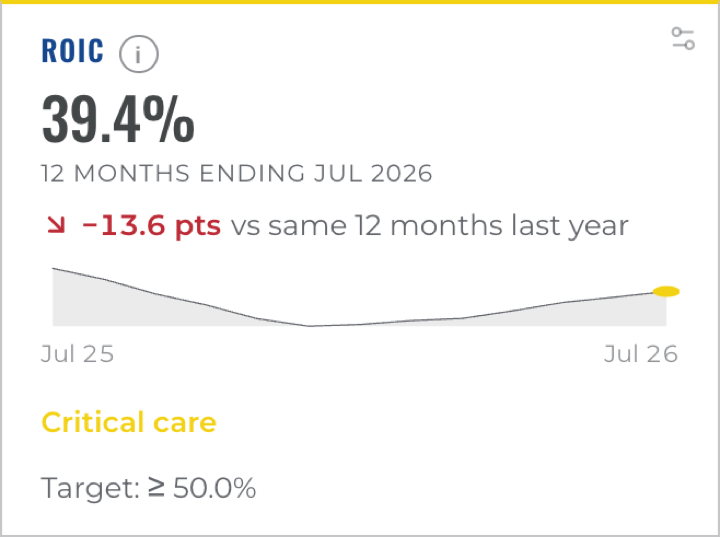
The return on the capital tied up in the business — the ultimate test of whether it’s worth more than the money invested in it.
See It In Action
Everything You Need
AI-Powered Classification
Your financials, automatically mapped into a CFO-ready model
Monthly / R3 / R12 Views
See any period, or smooth out noise with rolling averages
Editable Mappings
You stay in control — review and adjust every classification
Source Drill-Down
Click any number back to the account line it came from
Traffic-Light KPIs
Know at a glance what’s healthy and what needs attention
Targets & Salary Cap
Set target bands per metric and know exactly what payroll you can afford
Forecasts
Turn a hiring or pricing decision into a real monthly projection
What-If Scenarios
Test a decision against your real numbers before you make it
Power Plays
See instantly what a 1% price, cost, or efficiency change does to cash
Valuation Plan
Know your business’s multiple, not just its profit — and what moves it
Excel Export
Take any view with you
Works With Your Books
Import a P&L and Balance Sheet from any system, or connect QuickBooks live
See It On Your Own Numbers
Every screen below is built from a real QuickBooks export — no demo data, no mockups.
Start here
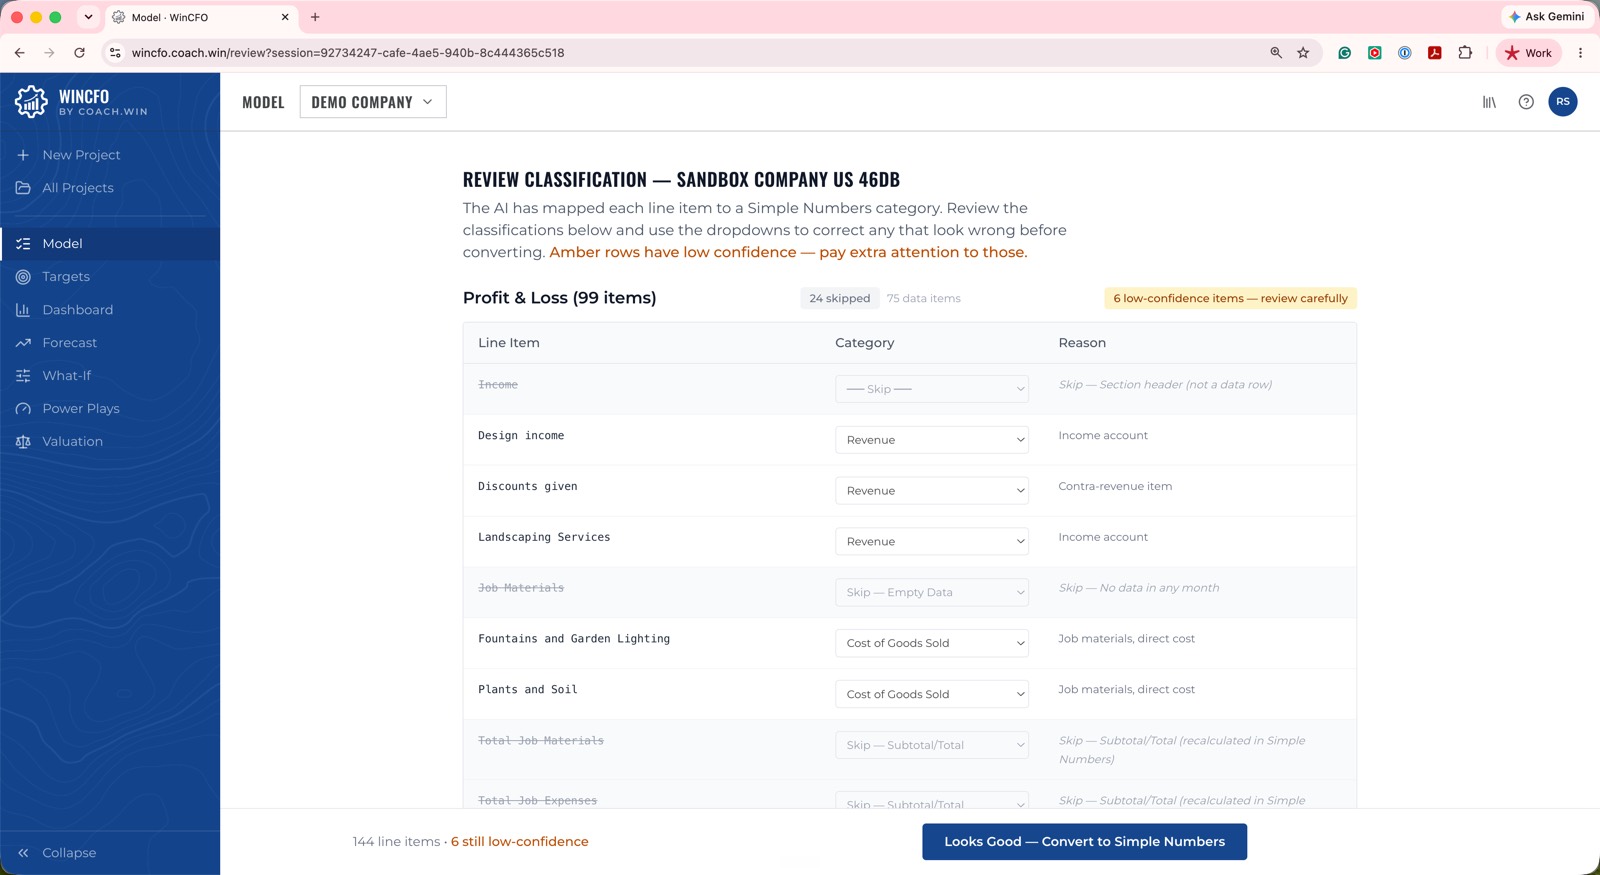
Your chart of accounts, understood
Upload a QuickBooks export and every account is classified automatically. Anything the model is unsure about is flagged for a quick human check rather than guessed at silently.
The one screen
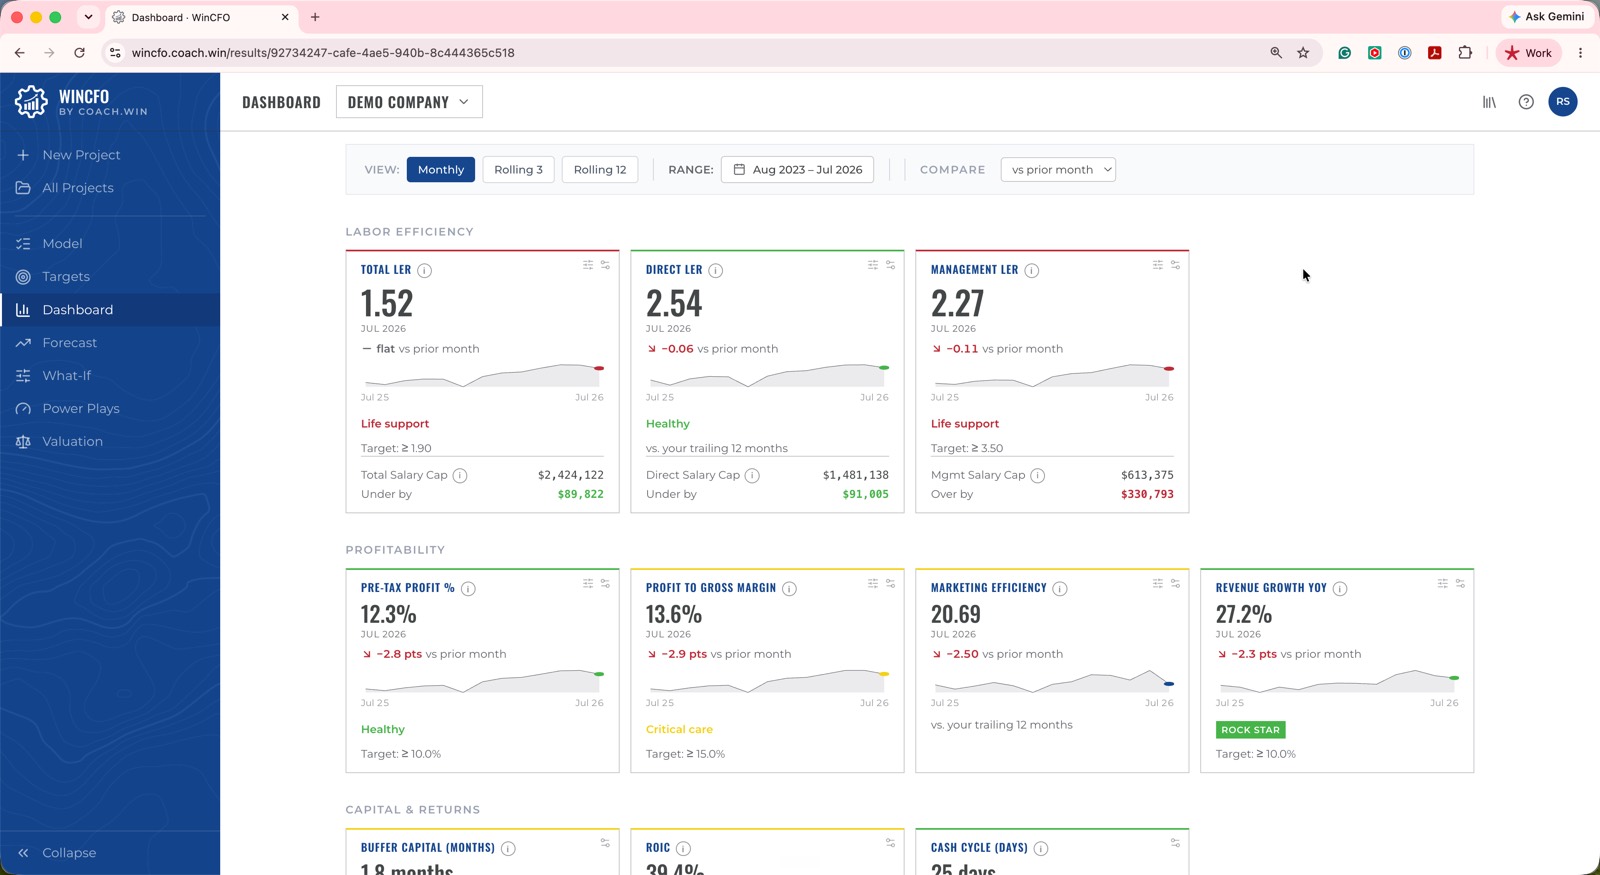
Where the business actually stands
Labor Efficiency Ratio, contribution margin, and the handful of numbers that decide whether the next hire is affordable — on one screen, from your own financials.
Targets
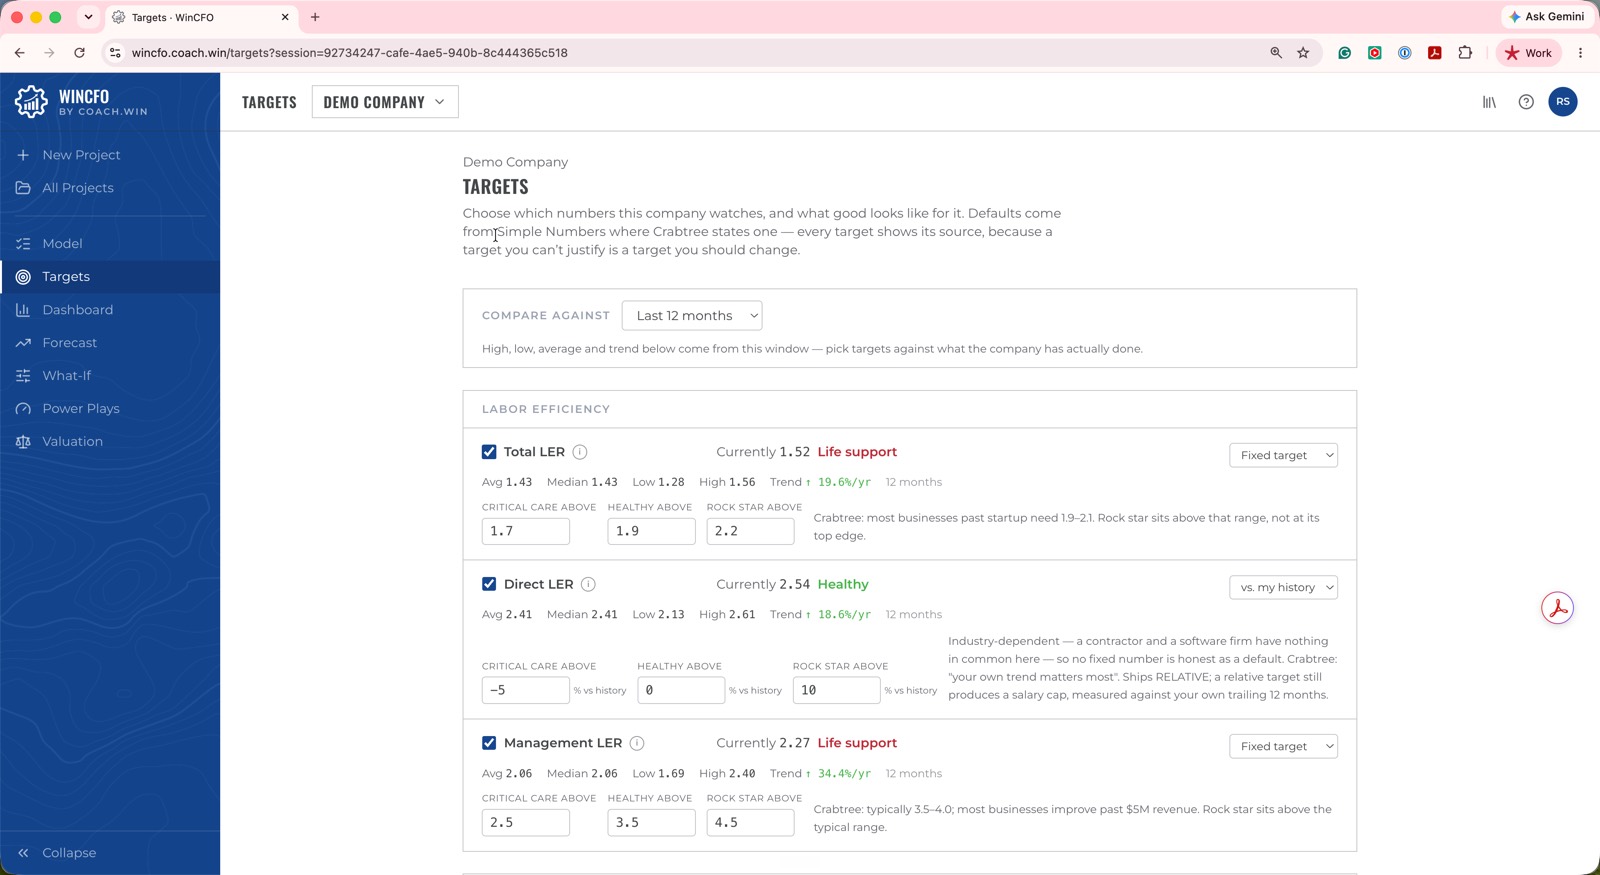
Targets with their reasoning attached
Every target shows where it came from, so a coaching conversation is about the business rather than about the spreadsheet.
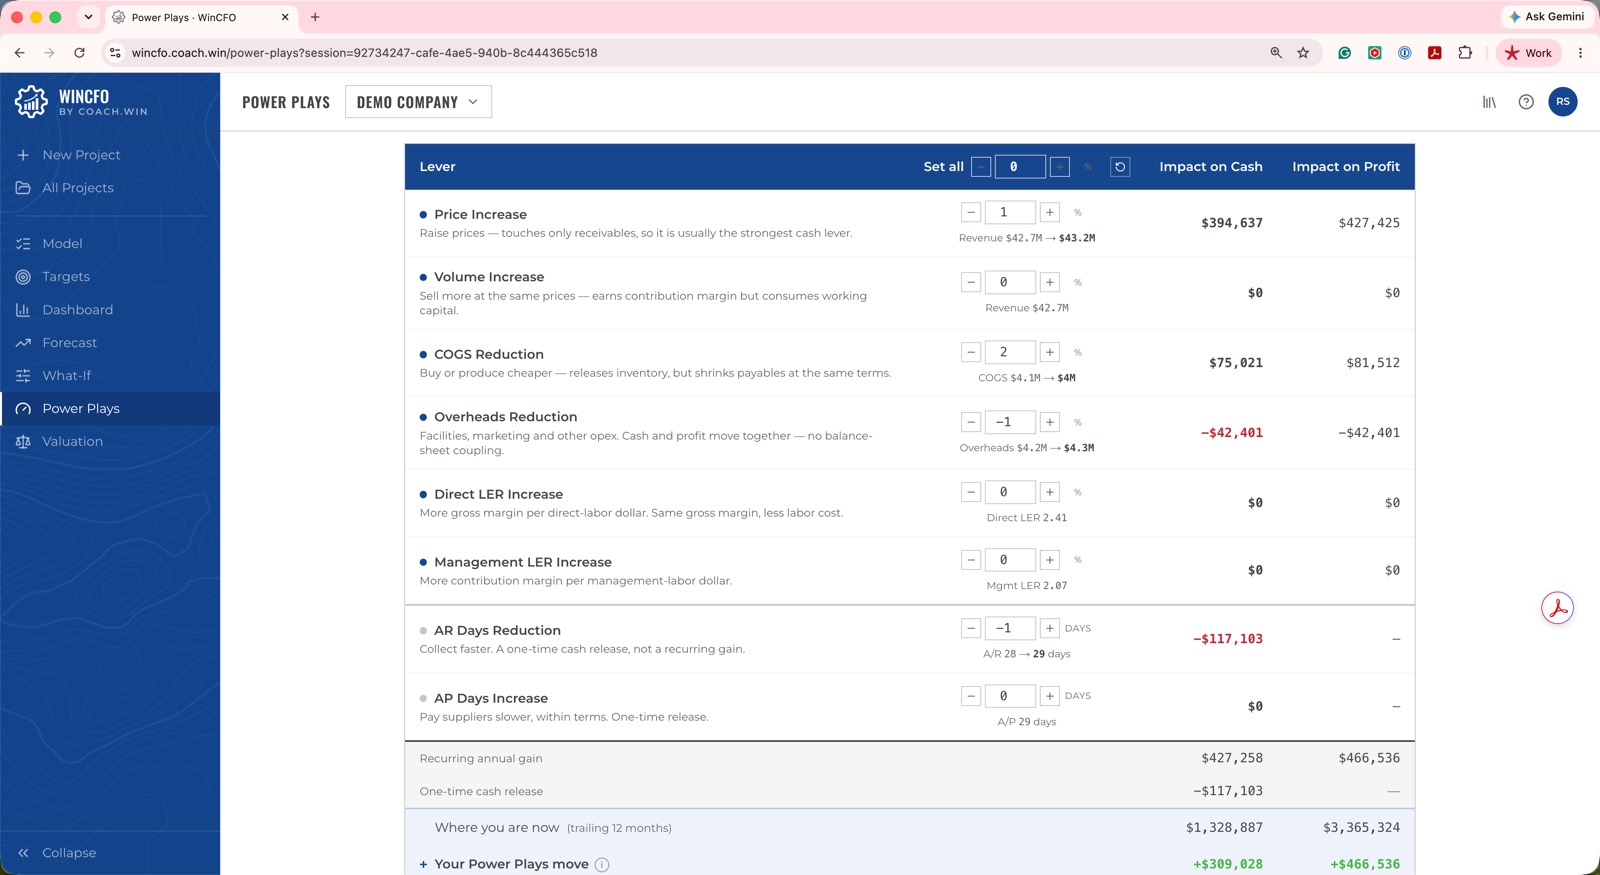
Power Plays
The levers, ranked by what they move
Each lever shows the number it moves and what it moves it to — so the conversation starts at the biggest available win instead of the easiest one.
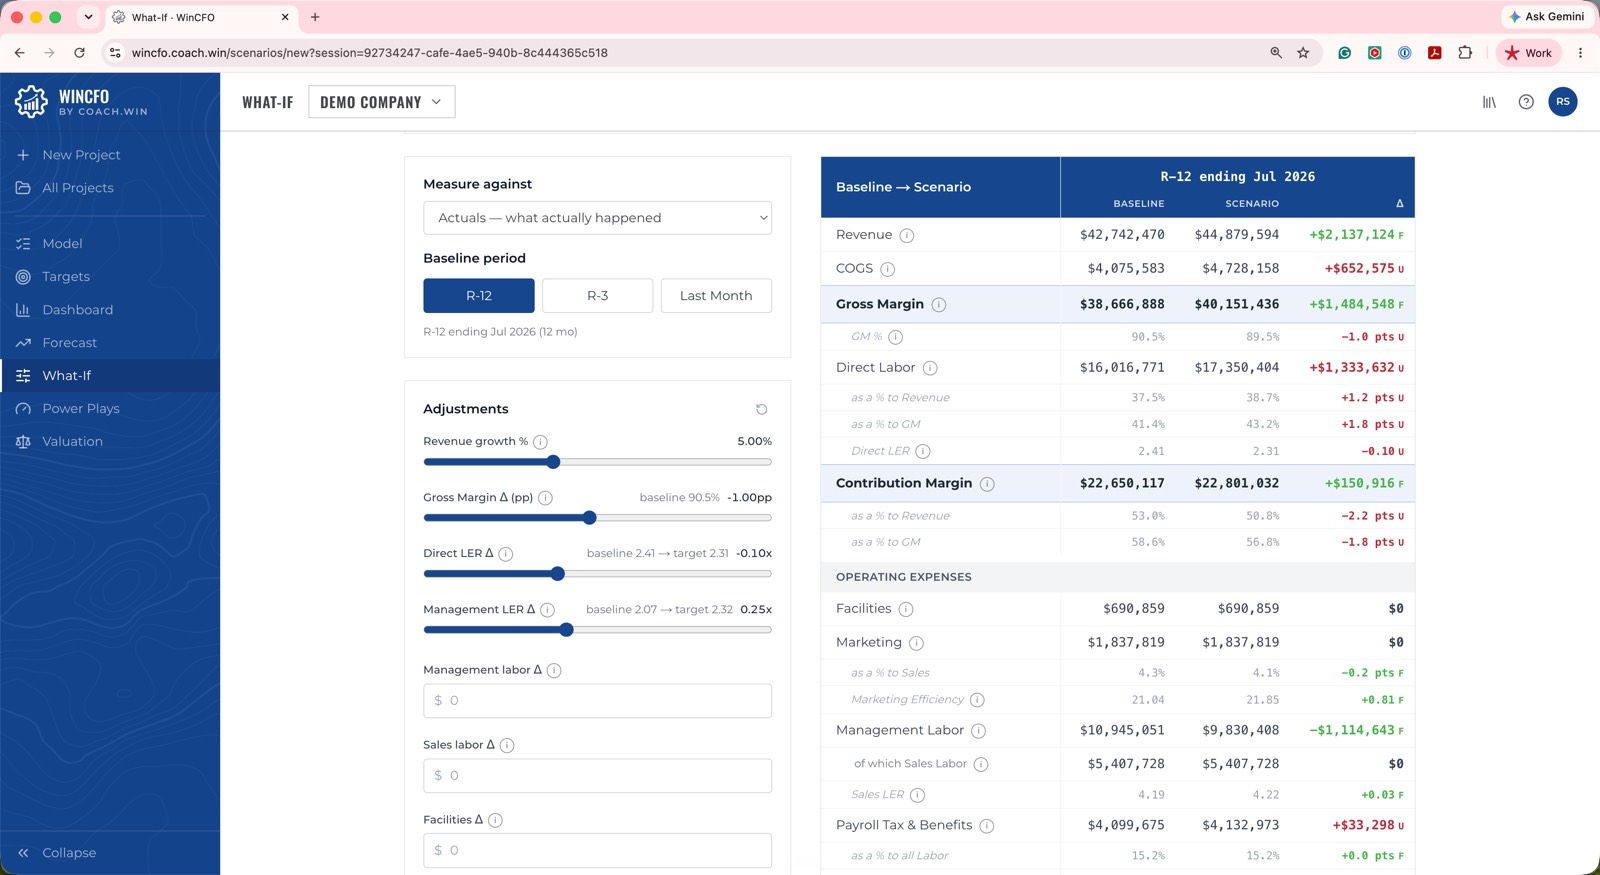
What-If
Answer the question in the room
"What if we raised prices four percent?" Change the input, watch the whole model respond, and save the scenario to compare against later.
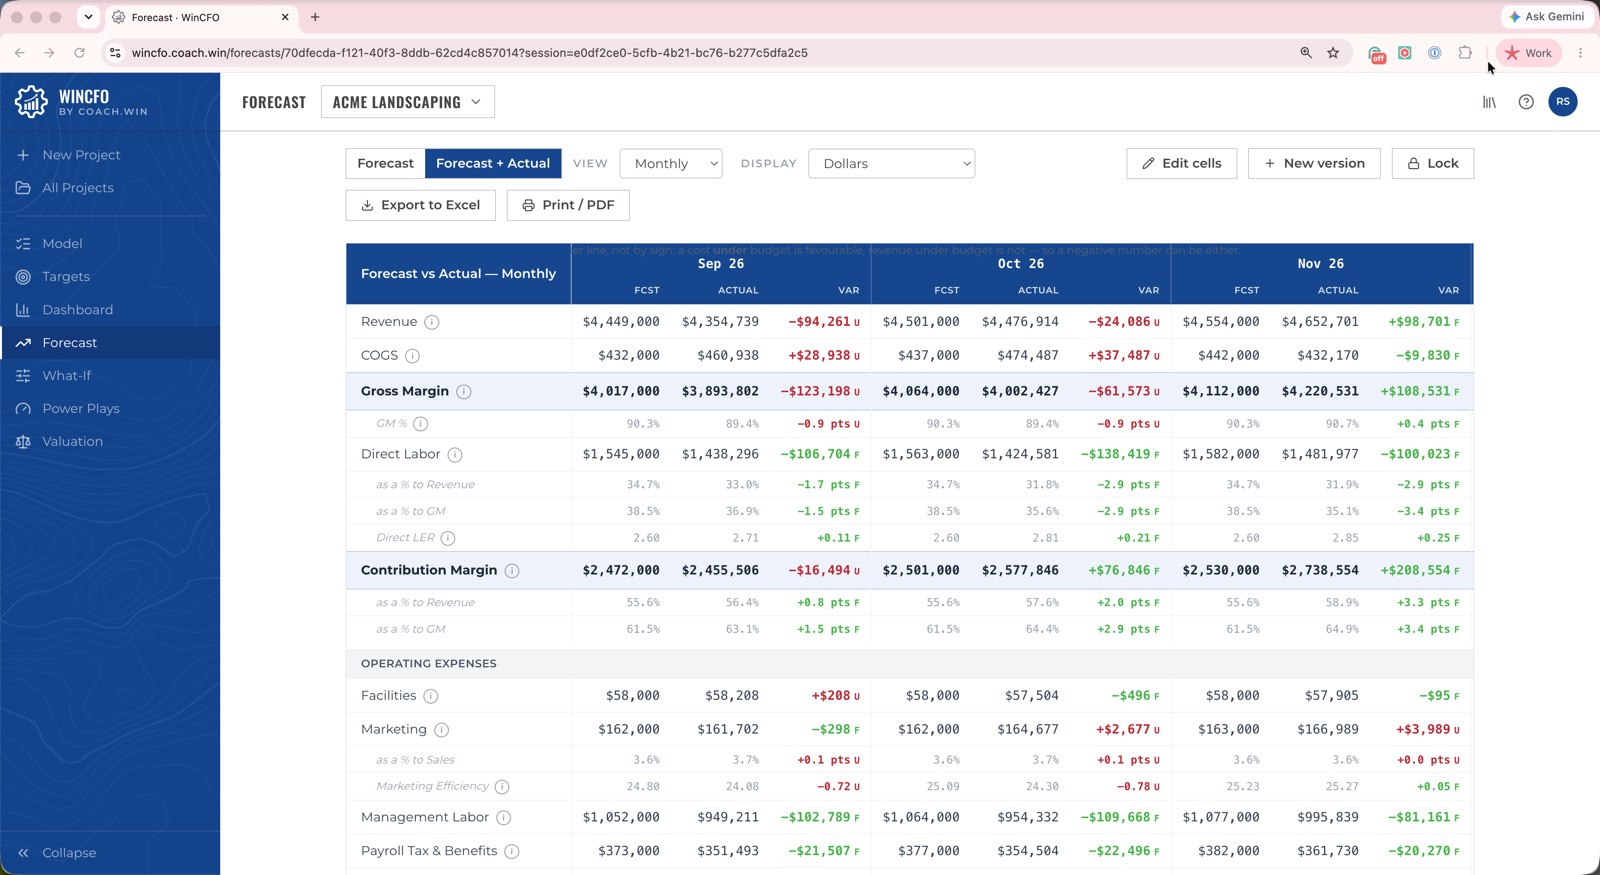
Forecast
Plan it, then watch it land
Turn a hiring or pricing decision into a real monthly forecast — then track every actual against it, line by line, with favorable and unfavorable variance flagged automatically. A plan you can actually manage to, not a spreadsheet you file and forget.
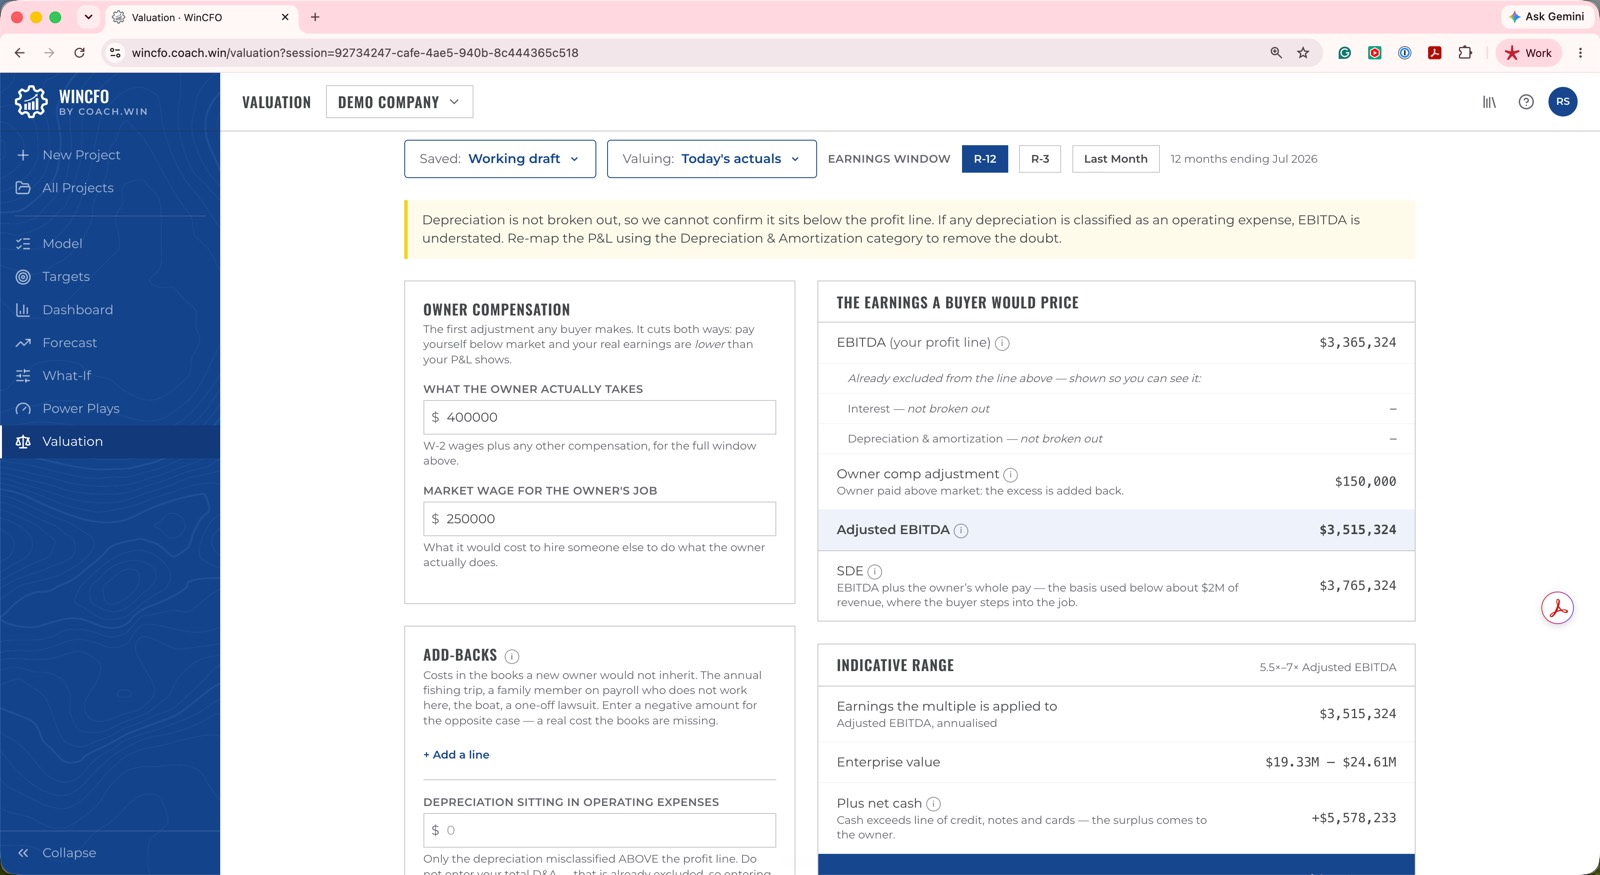
Valuation
What the business is worth, and why
Model add-backs and multiples, save competing positions side by side, and show an owner what closing the gap is actually worth to them.
Simple Pricing
One subscription, up to five active financial projects. Need more? Talk to us.
Limited-time introductory offer
Get 50% off your first 3 months — enter code WELCOME50 at checkout.
Enterprise
Let’s talk
More than five active projects, for firms and teams. Custom limits and pricing.
Prices in USD, exclusive of any applicable sales tax.
Your Financial Data, Protected
You're trusting us with sensitive numbers. Here is exactly how we keep them safe.
Encrypted end to end
All traffic runs over TLS. Your QuickBooks connection tokens are sealed with AES-256 authenticated encryption — the standard banks use — so they stay unreadable even in the unlikely event of a database breach.
Your data is yours alone
Every project is scoped to your account and no other user can reach it, by any path. Isolation is enforced at the database level, not just in the app.
Least privilege by design
Our application connects to the database with the narrowest possible permissions and cannot alter its own structure. Row-level security isolates every table of customer records.
Bank-grade payments
We never see or store your card. Payments run entirely through Stripe, a PCI-DSS Level 1 provider — the highest level of payment security certification.
We only read, never write
WinCFO reads your QuickBooks reports to build your analysis. It never creates, edits, or deletes anything in your books — your accounting records stay exactly as you keep them.
No passwords to steal
Sign-in uses single-use, time-limited secure links sent to your email. There is no password for an attacker to guess, phish, or leak.
Abuse-resistant
Sign-in and processing are rate-limited, security headers harden every page against common web attacks, and dependencies are continuously audited for known vulnerabilities.
Enterprise-grade infrastructure
WinCFO runs on Cloudflare’s global network — the same infrastructure protecting millions of the world’s largest sites — with automatic DDoS protection, a web application firewall, and DNSSEC that guards against traffic hijacking.